Here's what we keep seeing: a finance team buys Power BI, builds a few dashboards from CSV exports, and calls it done. Six months later, they've got 30 reports that don't agree with each other, no one trusts the numbers, and the CFO is back in Excel.
The tool isn't the problem. The data underneath it is.
When your data is properly structured and centralized, Power BI stops being a dashboard builder and starts being something much more useful — a platform that connects your systems, aligns your teams on one version of the truth, and actually supports Microsoft Copilot and AI the way Microsoft intended.
Power BI doesn't become a data platform by building more dashboards. It happens when the data underneath is structured, governed, and reusable.
That's where semantic models come in. A semantic model is a centralized layer that defines your business logic, metrics, and relationships — so every report works off the same foundation. Instead of every team building their own version of "revenue," you define it once and reuse it everywhere.
On top of that, Microsoft Fabric provides the underlying data architecture — bringing your data into a unified environment that supports scale, performance, and AI. Together, semantic models and Microsoft Fabric are what allow Power BI to move beyond reporting and into the use cases we cover below.
Here are 10 ways we help finance teams make that shift.
Most finance teams know they need better reporting — but getting started is where things stall. What should dashboards look like? How do you design something that works across finance, sales, HR, and operations? Even with outside help, you're still expected to define requirements, review designs, and commit to a long rollout before seeing real value.
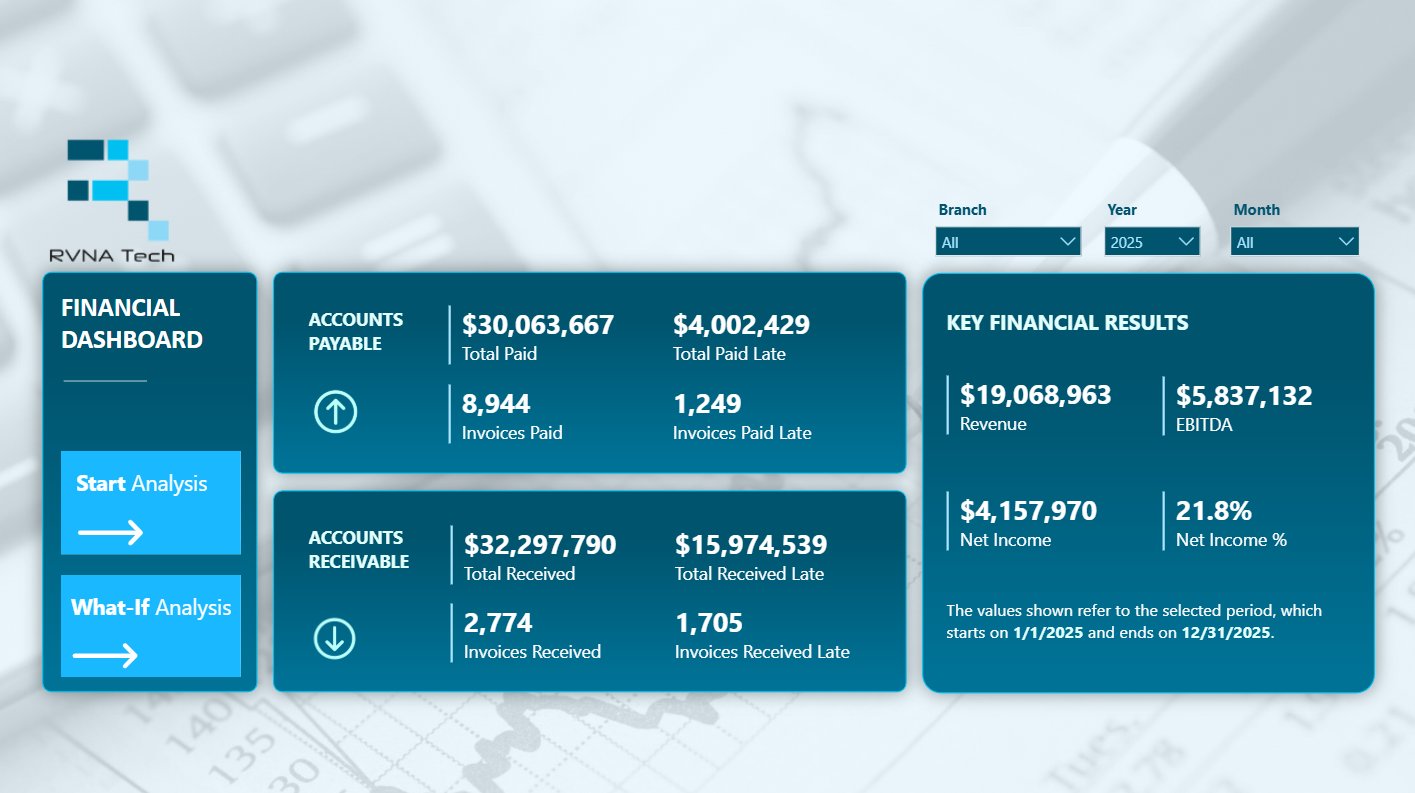
A faster way to get started is with our pre-built dashboards across finance, sales, HR, and operations — designed using best practices and ready for your data.
You're up and running in weeks, not months, and can build from there — refining and expanding based on what actually works for your business.
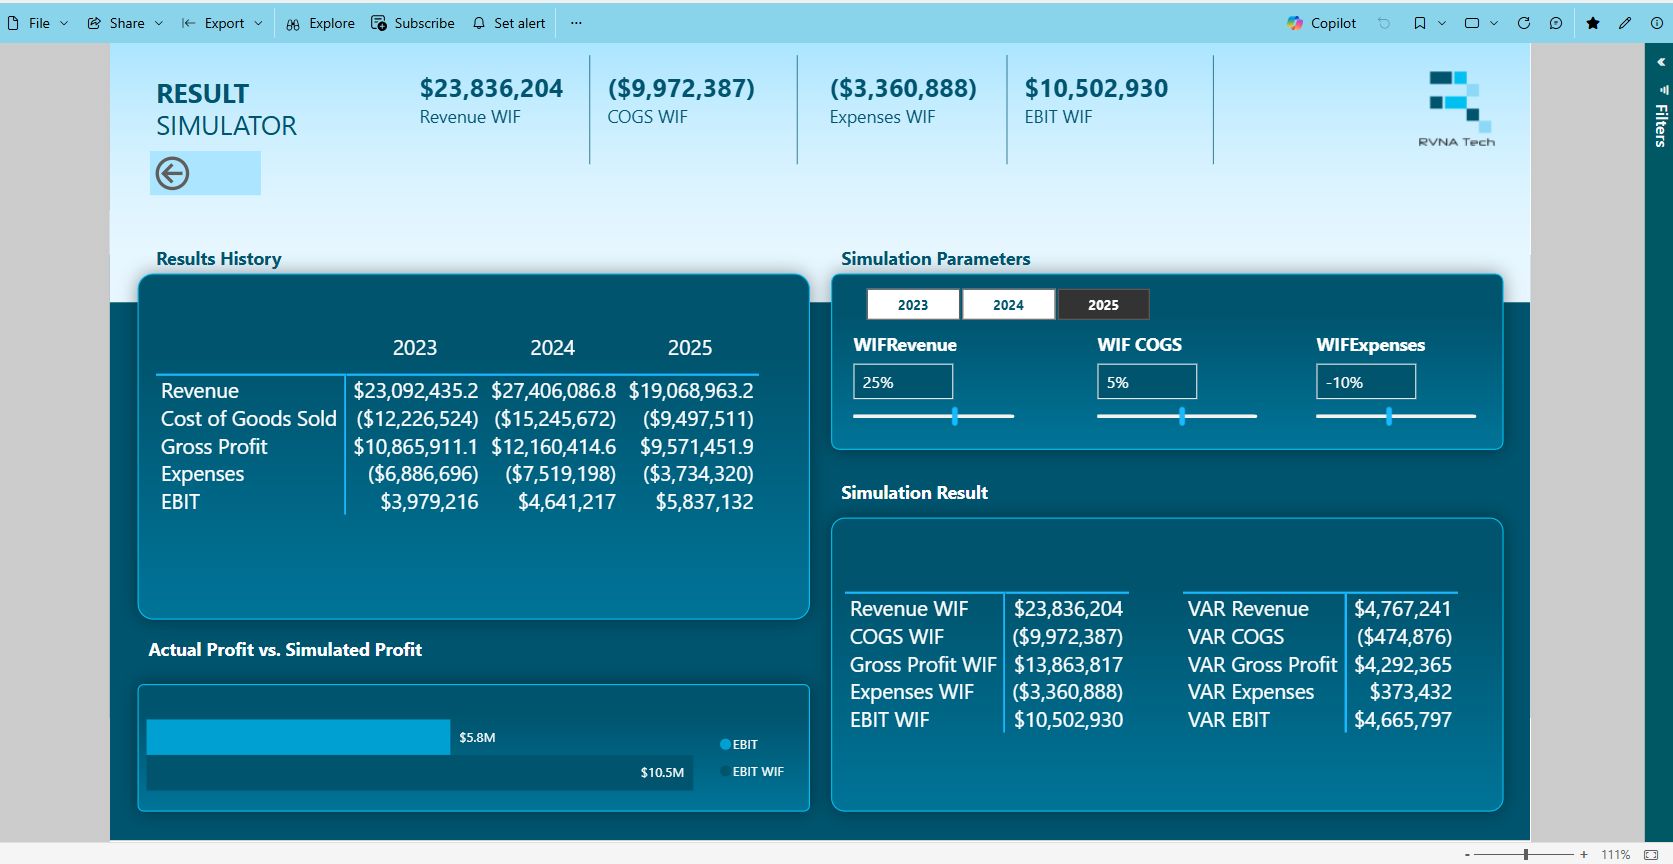
Your operational dashboards should stay fast — focused on recent data, optimized for daily use. But when your FP&A team needs to run a 5-year trend analysis or build a baseline for forecasting, they need a dedicated historical data layer. We build that layer so your team can pull 3–10+ years of data for trend tracking, AI modeling, and variance analysis without slowing down the dashboards everyone else relies on.
Most ERPs hold solid, reliable data. The problem is getting to it. Users click through 6 screens or export to a spreadsheet just to answer a question their system already knows the answer to. We don't replace your ERP — we put a Power BI reporting layer on top of it so your team can actually access what's already there.
Most mid-market companies are still paying for separate applications for sales performance management, variable compensation, and half a dozen other niche functions — each with its own license, its own implementation, and its own support contract.
For organizations with lighter requirements, many of those use cases can be handled directly in Power BI. That's not a theory — we've helped clients eliminate six-figure software spend by consolidating capabilities they were overpaying for into a platform they already had.
Two ERPs. A CRM that lives on its own island. A planning tool with its own version of revenue.What used to be an integration problem is now a SaaS sprawl problem. Different teams adopt their own cloud systems — often without coordination — creating silos across finance, sales, and operations. In other cases, fragmentation comes from M&A activity, regional autonomy, or different business units standardizing on their own tools. At the corporate level, it becomes nearly impossible to tie everything together cleanly.
The result is more fragmentation, not less — and teams fall back on spreadsheets to reconcile it all.
We bring these systems into a unified reporting layer within Power BI, giving you a single source of truth so your finance team can stop reconciling numbers and start analyzing them.
ERP migrations aren't just system changes — they're data problems. Fields don't match. Structures are different. And moving data directly from one ERP to another often means carrying over inconsistencies, or spending significant time and cost trying to clean things up mid-migration.
A more practical approach is to first bring your data into a centralized layer, where it can be structured, cleaned, and aligned to how your business actually operates — while already supporting reporting in Power BI.
When you're ready to launch your new ERP, this same data hub becomes the bridge — connecting your reporting layer to the new system, without needing to rebuild everything from scratch.
At the same time, your reporting stays intact throughout the transition — so you don't lose visibility while systems are changing.
This makes the transition simpler, faster, and far less dependent on heavy consulting.
Many platforms charge full-price licenses to users who only need to view data — they're not building anything, they're not configuring anything, they just need to see a report. By shifting that read-only access to Power BI, you reduce licensing costs while still working from the same underlying data.
The biggest reason BI projects stall in larger organizations isn't complexity — it's inertia. Everything feels like a massive undertaking, so nothing gets approved. We change that by delivering a focused proof of concept using your actual data, typically in a few weeks. Real dashboards, real data integration, real Microsoft Copilot and AI capabilities — something your team can see and react to. That momentum is usually what gets the larger initiative funded.

When the CFO's dashboard says one thing and the VP of Sales' report says another, the first casualty is trust. A single source of truth — consistent definitions, consistent calculations, one shared data model — eliminates the "my numbers don't match yours" conversations that waste everyone's time.
This is the one we see most often. A company has been running the same ERP for 10–15 years. The data inside it has drifted — duplicate records, inconsistent naming, fields that mean different things in different departments. So the finance team stopped trusting it. They export everything to spreadsheets, clean it manually, and build their own version of the truth outside the system.
We fix this at the source. When we build a data hub alongside Power BI, we clean, standardize, and structure the data as part of the integration — not after. By the time it hits your dashboards or AI tools, it's accurate and trusted. Your team can rely on system-driven reporting again, and stop running the business in spreadsheets.
Book a fit check with RVNA Tech. We'll review your environment and give you a clear recommendation on where to start — based on your systems, your data, and what's actually going to move the needle.